I built an OLED protection app, then reverse-engineered my monitor
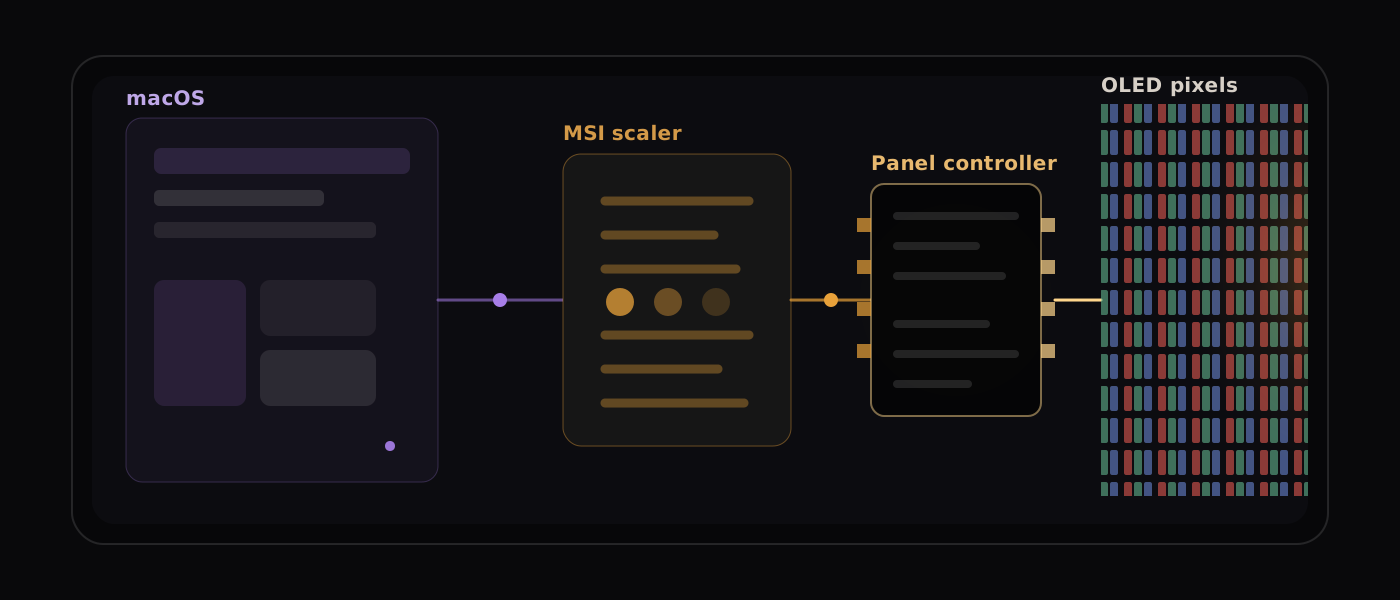
I spent three weeks building Candela.fyi, a Mac app to help prevent OLED burn-in. Then I realized my monitor might already be doing the same job.
It advertised static-image detection, pixel shifting and panel compensation. I probably should have looked into those before writing the app. Before writing off three weeks of work, though, I wanted to find out what those features actually did, and whether there was anything left for software on the Mac to do.
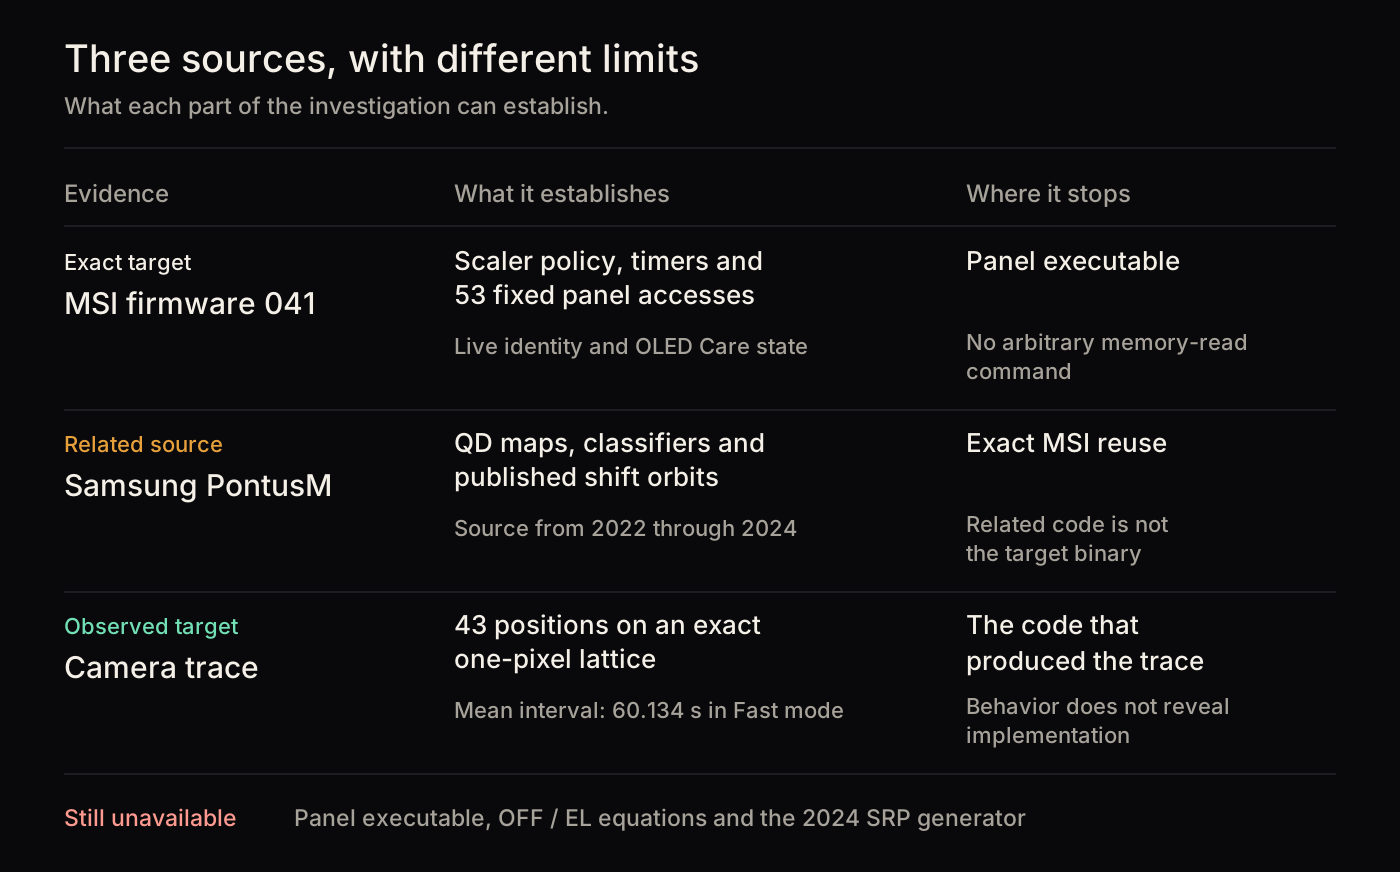
I started with the firmware update for my MSI MAG 341CQP. Tracing its OLED Care settings led to 53 transactions with a separate Samsung panel controller. The firmware could enable a detector or request a maintenance cycle, but the algorithms behind those commands lived on the other chip. The update did not contain them.
Samsung's public source for related displays offered a way to investigate that missing layer. It contained regional dimming logic, retention classifiers and explicit pixel-shift tables. I reconstructed three generations in a simulator to work through their timing and state transitions. That produced a testable question: did my MSI follow the published pixel-shift path?
A screenshot could not answer it. The monitor shifts the image after it leaves the Mac, so I filmed a test pixel against a stationary physical reference. Over 43 minutes, the timing agreed with Samsung's nominal one-minute interval. The third measured position ruled out exact execution of its published normal table, although longer stretches matched later in the recording.
The result was a partial account of how OLED protection is divided between the computer, the monitor's control firmware and the panel itself. That division matters to the app: which decisions can desktop software make, which does the monitor already make, and which require physical panel state that macOS cannot see?
The findings below establish parts of that division. They do not measure Candela's effect on long-term wear.
The first firmware stopped one chip too early
My MAG 341CQP runs firmware 041 and has a first-generation 34-inch Samsung QD-OLED panel. MSI publishes firmware updates for the monitor. Version 041 is a complete image for its Novatek scaler, the chip that handles inputs, menus, product policy and most of what makes the panel an MSI monitor.
The image contains several processor architectures, fixed tables and erased padding. Its partition table accounts for every populated region; I found no separate panel-firmware payload. The firmware boundary report records the recovered panel-care state machines and their limits.
The image did contain the controls for OLED Care. I recovered 53 transactions to a Samsung controller at bus address 0x60. Every transaction uses a fixed 16-bit register address. The monitor's settings map to those registers. An annotated instruction trace follows the pixel-shift speed setting through a tail jump to the panel-register write.
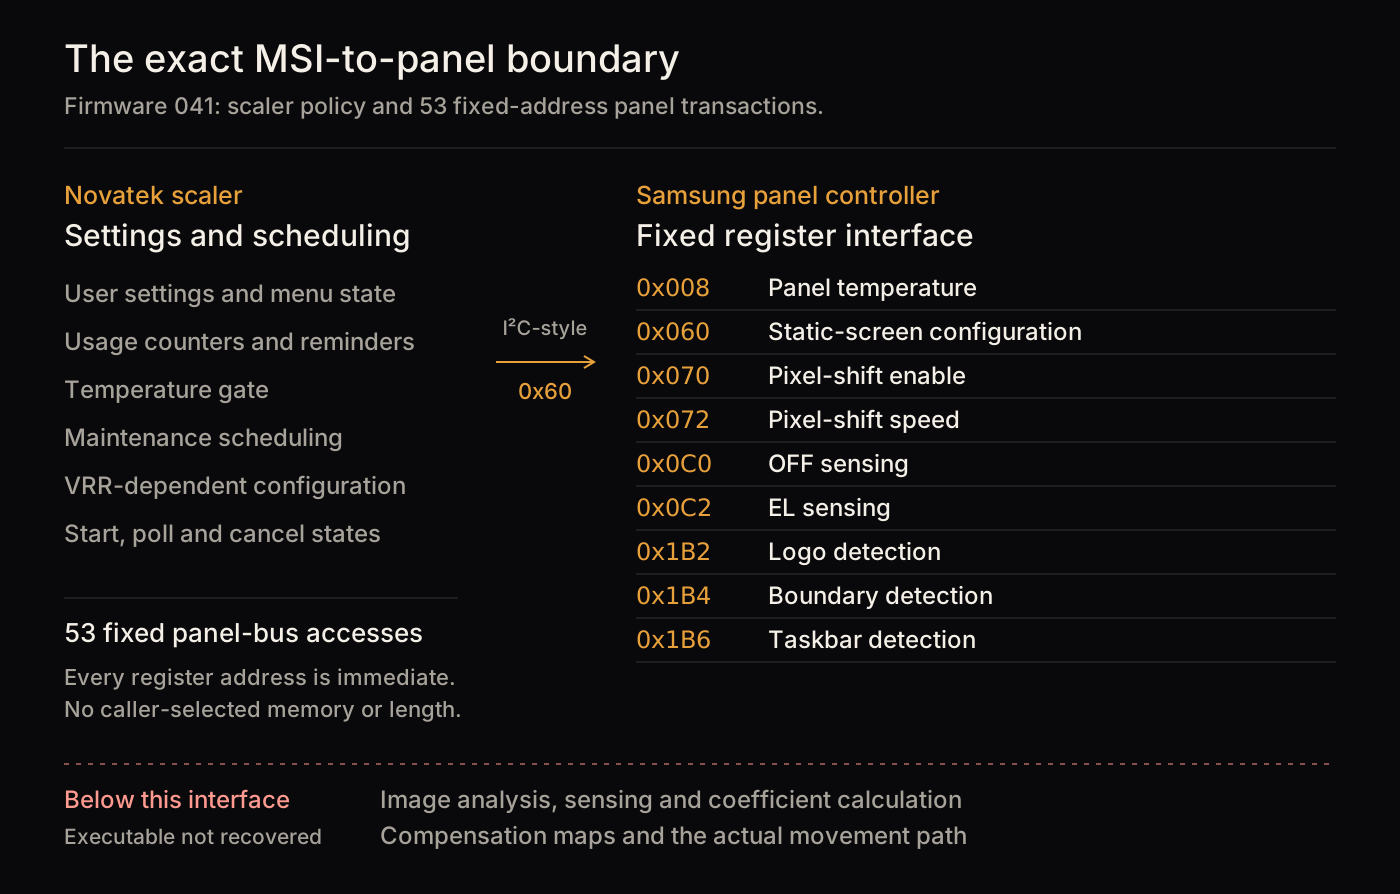
Register 0x060 carries static-screen settings. 0x070 and 0x072 enable pixel shifting and select Slow, Normal or Fast. Three separate controls go to 0x1B2, 0x1B4 and 0x1B6 for logo, boundary or pillar, and taskbar detection. The maintenance paths trigger 0x0C0 for the shorter OFF-sensing cycle and 0x0C2 for a longer EL-sensing sequence. Before either cycle, the scaler reads panel temperature from 0x008 and refuses to proceed above its limit.
This code identifies the operations, MSI's schedule and each gate, including the settings disabled during variable refresh rate. It never calculates a logo map, decides that part of an image is static, derives a compensation coefficient or moves an individual pixel. For those jobs, the scaler writes a register and waits for the Samsung controller.
The update was for the scaler. The algorithm I wanted was one chip farther down.
The monitor was more readable than I first thought
The firmware also contained the commands used by MSI's Gaming Intelligence USB interface. I built a reader that permits only the literal GET commands in that table. It has no arbitrary opcodes or write implementation. I then tried those commands against the connected monitor.
The replies identified firmware 041, controller V70 and panel payload SDC QMC340CC01_D01. They reported Pixel Shift set to Fast and static-screen, multi-logo, taskbar, boundary and protect-notice controls enabled. Standard DDC/CI reads also returned the monitor's capability string, current state and a live usage counter.
That result corrected one of my earlier conclusions. I had classified the MSI as write-only because every DDC reply appeared to be zero. My request checksum was wrong because I had omitted the source address. The reads worked repeatedly after I corrected the frame.
Those replies validate the command table and the recovered scaler model. They report configured state, not the Samsung chip's internal state. Asking whether Logo Detection is enabled returns 1. It does not return the regions currently classified as a logo.
Samsung published the closest thing to an answer
Samsung's Open Source Release Center has PontusM display-platform archives from 2022, 2023 and 2024. They include QD_burn_in.c, a burn-in-prevention worker, and BIP, Samsung's pixel-shift system. I recorded the archive names, release IDs, file paths and hashes so readers can locate the same code.
PontusM is a Samsung Electronics TV and smart-monitor platform. The MSI uses a Novatek scaler connected to a Samsung Display panel controller. The archive contains Samsung QD production code, but it is related source, not the executable inside my MSI.
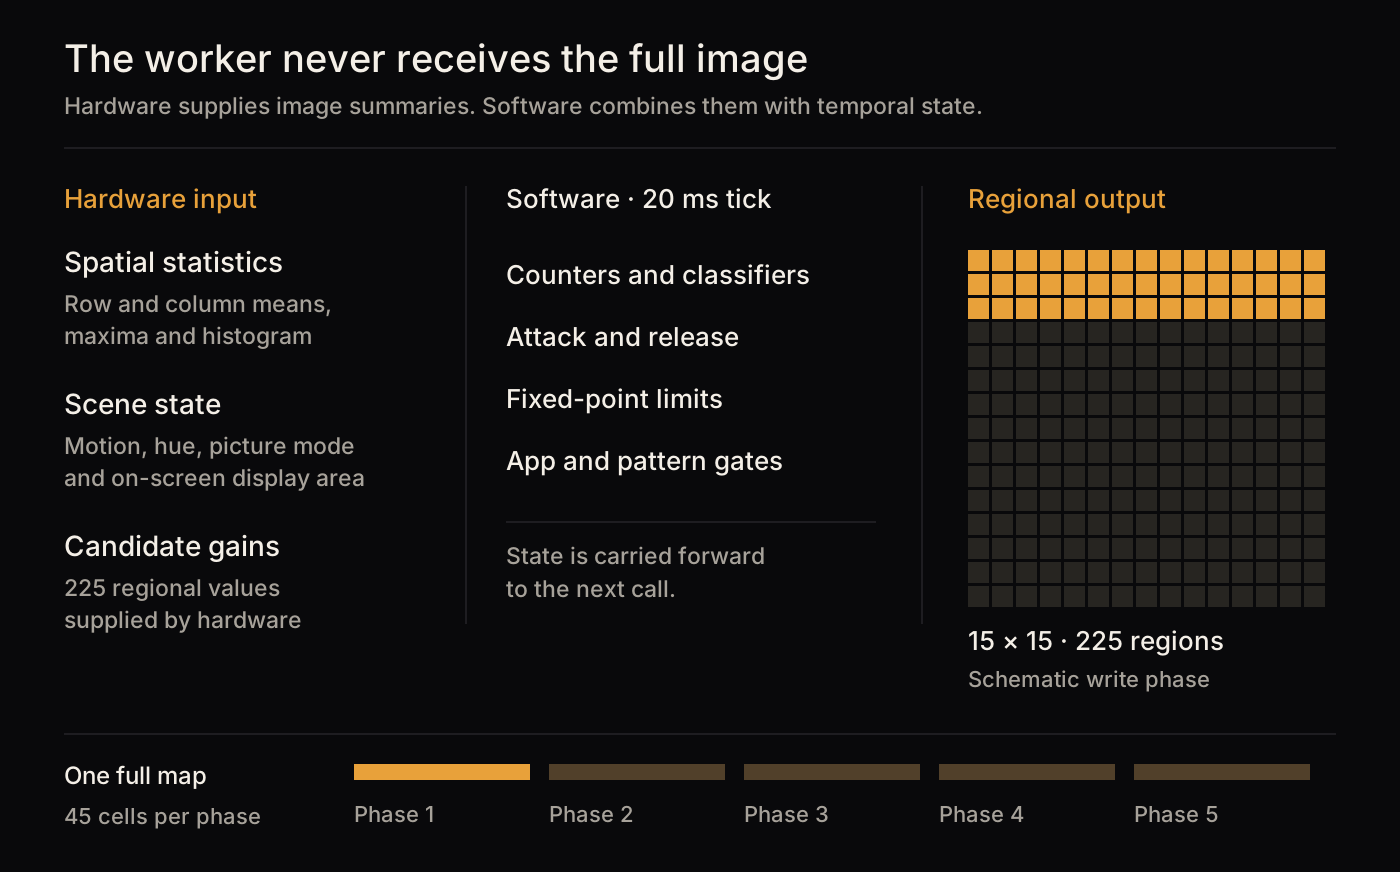
The worker runs on a nominal 20 millisecond tick. Hardware supplies row and column means and maxima, a histogram, hue, black and pattern probabilities, whole-image brightness, motion, picture mode and the area occupied by the on-screen display. The worker maintains a 15 by 15 grid of 225 regions. It updates 45 cells at a time over five phases.
The 2022 and 2023 versions include a retention classifier. One source comment reads // Rtings Retention. The 2023 curve controller counts consecutive asserted ticks and arms at 3,500:
uLD_fcn_cnt = (uLD_fcn_cnt < 3500) ? uLD_fcn_cnt + 1 : 3500;

if (uLD_fcn_cnt > (3500 - 1)) uLD_fcn_on = 1;
These are lines 2343–2345 of the 2023 QD_burn_in.c, with whitespace normalized. The source notes locate the enclosing condition. At the nominal 20 ms tick, the counter takes about 70 seconds to arm a 41-point global curve. At the maximum input code, that curve produces roughly 58 percent of full-scale digital output. This does not mean luminance falls to 58 percent. The panel's transfer function and every later stage still affect the emitted light.
The code also applies local protection. Candidate regions reduce output, then recover after the content changes. It handles flat fields, standard patterns and HDR color patterns separately. App and on-screen-display state can impose a uniform ceiling. Another accumulator tracks long-window peak exposure.
Version 20 adds a lower-screen detector named QD_CNN_DETECTION. It examines broad RGB and average-picture-level boxes near the bottom of the image. It also checks temporal change, brightness and color neutrality before accumulating a probability and history. The function has no neural-network call, model file or inference API. An unpublished earlier stage may still exist, but the published function is a threshold-based banner heuristic.
The next release changed the algorithm
It would be tempting to call that 2022/23 path "how Samsung OLED Care works." The 2024 source shows why that claim would be too broad.
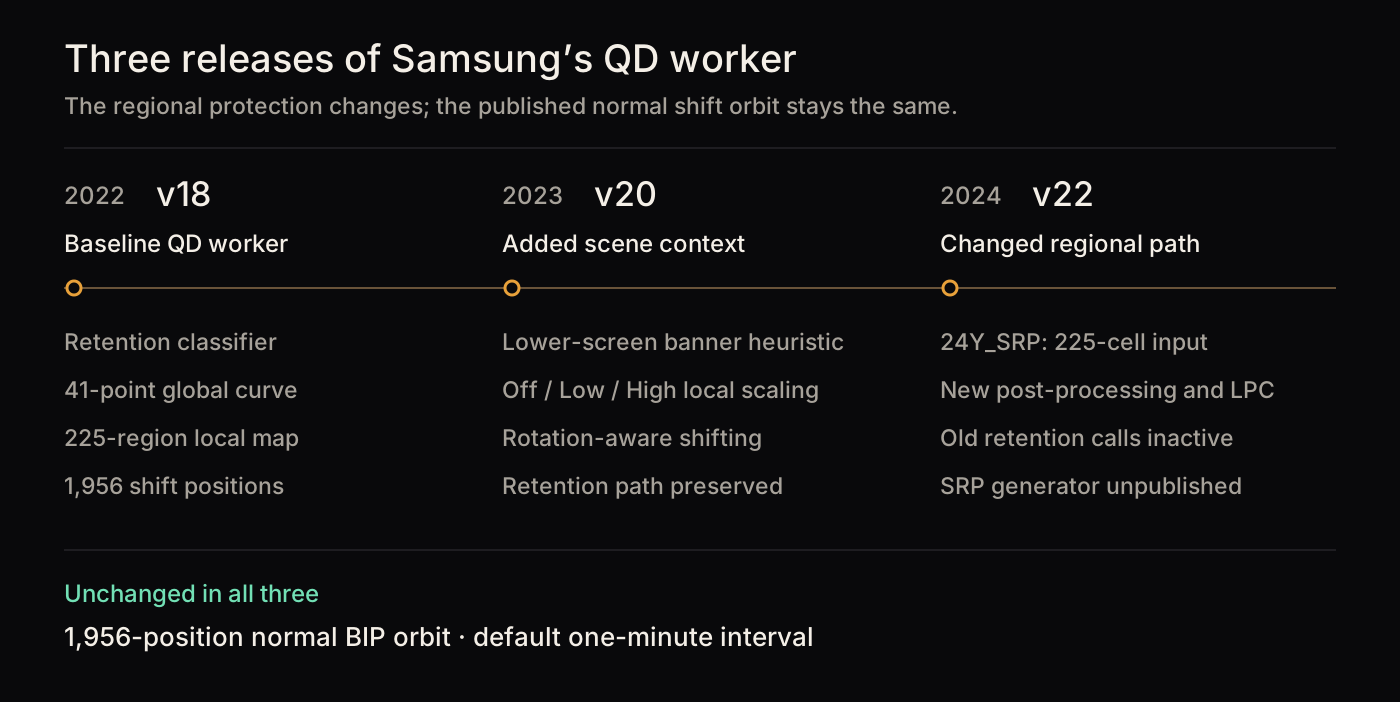
In the 2024 worker, the two calls are visibly disabled:
// QD_RETENTION_DETECT(LD_BASE_ADDR);
// QD_FCN_CURVE_CTRL(LD_BASE_ADDR, uLD_BLK_DB_SEL);
These are lines 462–463 of that release's QD_burn_in.c. Version 22 instead configures 24Y_SRP, reads 225 candidate coefficients from hardware and applies revised local processing. Thresholds, rounding and dark-image handling change too. The 2024 source notes summarize the differences.
The source shows how software processes the new 225-cell map. It does not include the map generator. The 2024 archive exposes more post-processing, while unpublished hardware or firmware still decides each candidate gain.
The published pixel-shift table changes less. All three releases contain the same 1,956-position normal orbit spanning plus or minus 16 pixels. Versions 20 and 22 also contain a 4,102-position rotation table. The default interval is 3,000 nominal 20 millisecond ticks, or one minute.
Turning source code into a prediction
Reading C shows what each line appears to do. It does not prove that you understood the integer widths, counter boundaries, update phases and interacting state machines. I wanted the source to produce predictions I could test.
I translated the three versions into a bounded Python simulator. It models the published integer logic, temporal state, 225-region map, global curve, lower-screen banner path and BIP index advancement. It also models the MSI scaler's maintenance state machines. Ten scenarios cover motion, static and black screens, factory color bars, retention, app and on-screen-display limits, a taskbar-like banner, pixel-shift rotation, recovery and the version-22 changes. Its 265 tests check the reconstructed logic; archive verification checks the source identity. Neither validates the unpublished MSI panel algorithm.
For a direct check, I also compiled Samsung's original curve-controller function and compared it with the Python reconstruction. The counter, gain and all 41 curve points matched across 25,008 calls through the threshold, saturation and recovery. That validates this function over those inputs, not the whole simulator.
The simulator labels each boundary instead of filling it with a guess:
- Source-translated. The published source contains the code, constants and state transitions.
- Source-abstracted. Published software receives these values from hardware, so each scenario supplies them explicitly.
- Unavailable. This includes the MSI panel executable, the 2024 SRP generator, and the electrical equations and maps behind OFF and EL sensing.
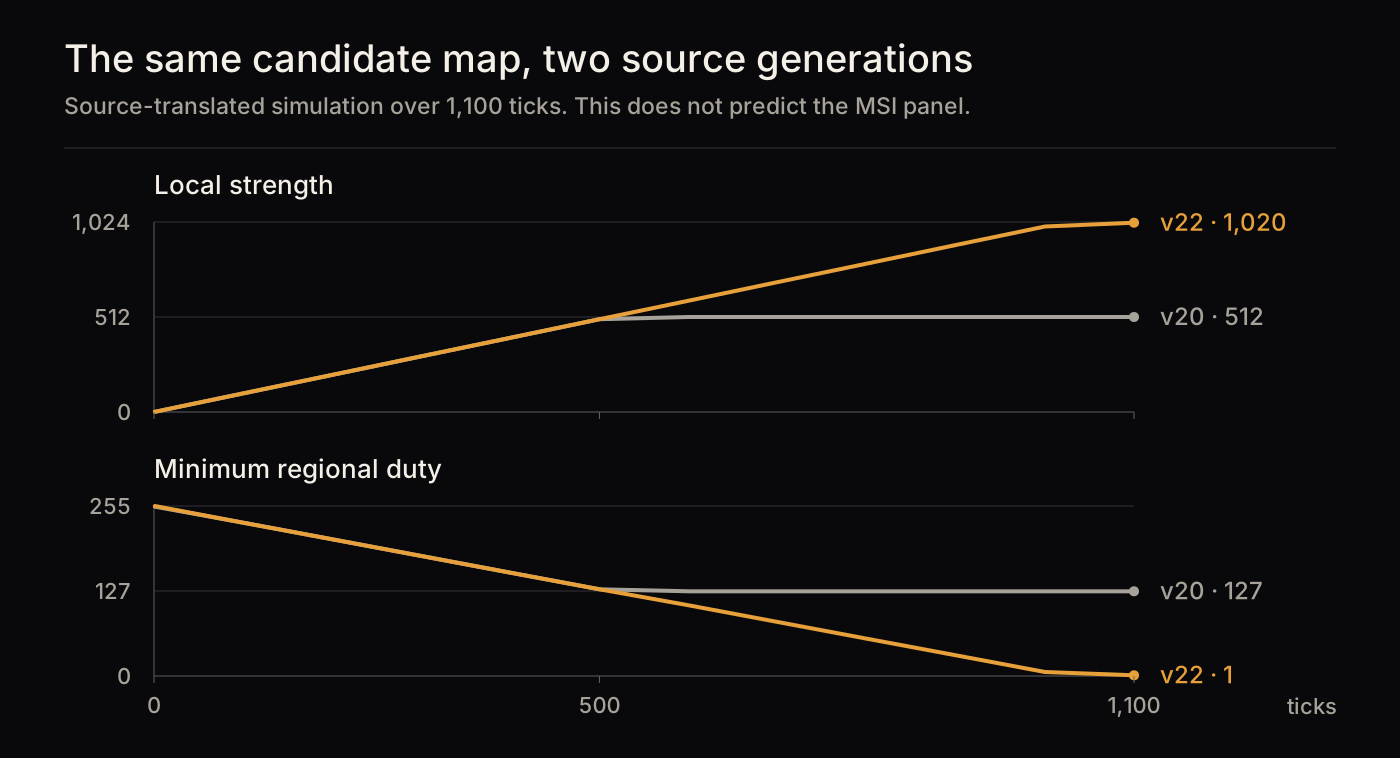
That distinction matters. In the focused version-22 scenario, the same hardware-supplied candidate map drives version 20 to local strength 512 and minimum duty 127. Version 22 continues to local strength 1,020 and minimum duty 1. The scenario report records the comparison. Even these adjacent releases cannot be treated as one algorithm.
The simulator could explain the published logic. To test a prediction on the real MSI, I needed a behavior the camera could observe directly.
One pixel at a time
The recording near the top of this article was my test of that prediction.
Pixel shifting is useful for a physical test because it changes geometry instead of brightness. A host screenshot cannot see it because the shift happens after the frame leaves the Mac. A camera can compare the active image with the physical bezel.
The test image placed a single white source pixel on a black background near the bottom-right of the screen. In the setup phase, a 65-source-pixel square around the point provided a scale. Both phases were in the same recording.
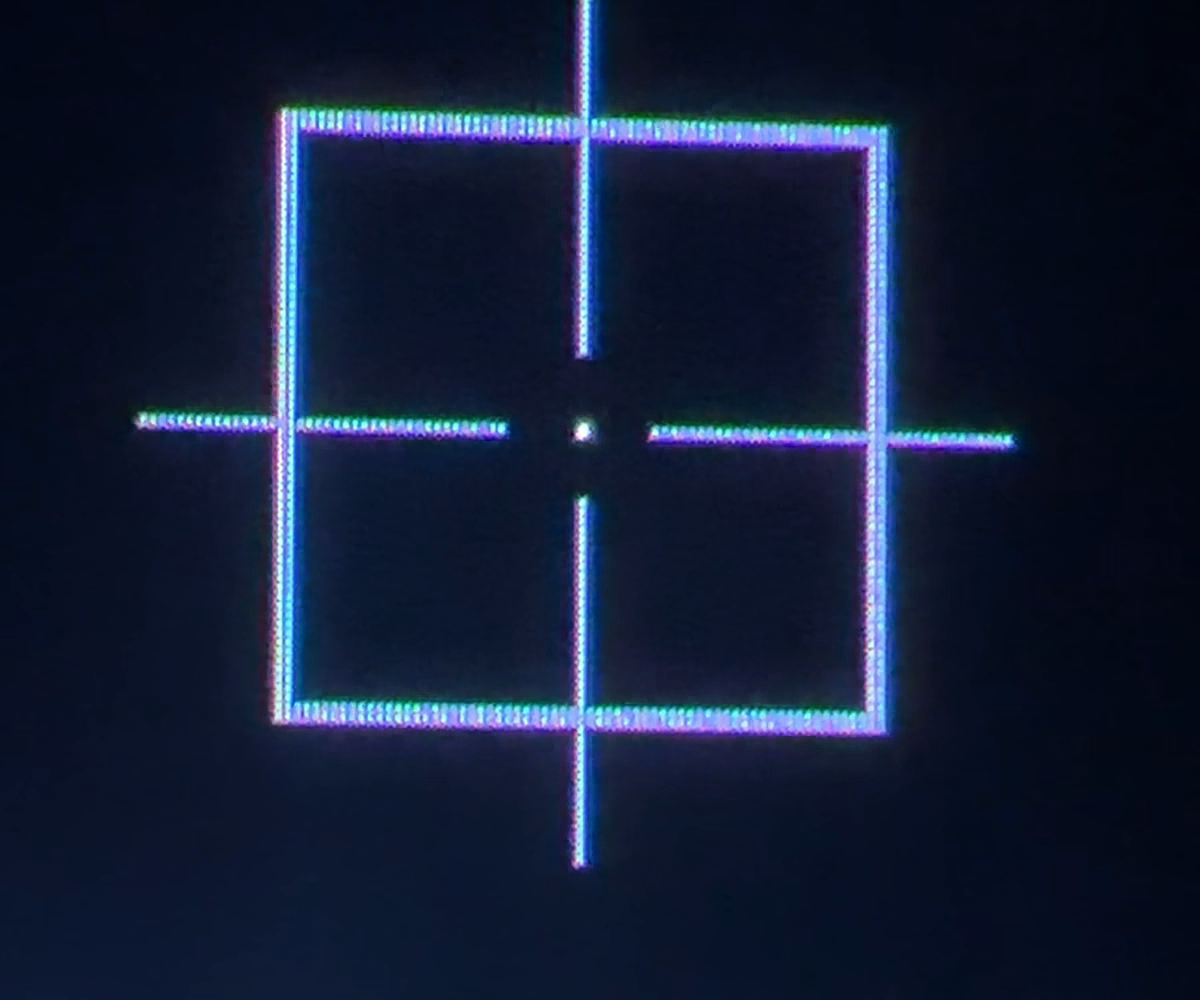
The recording also included stationary structure outside the active image. The analysis tracked that reference and the point separately, corrected each transition for camera motion, and rounded only after converting the result into source-pixel units. The capture notes and calibration measurements document the procedure.
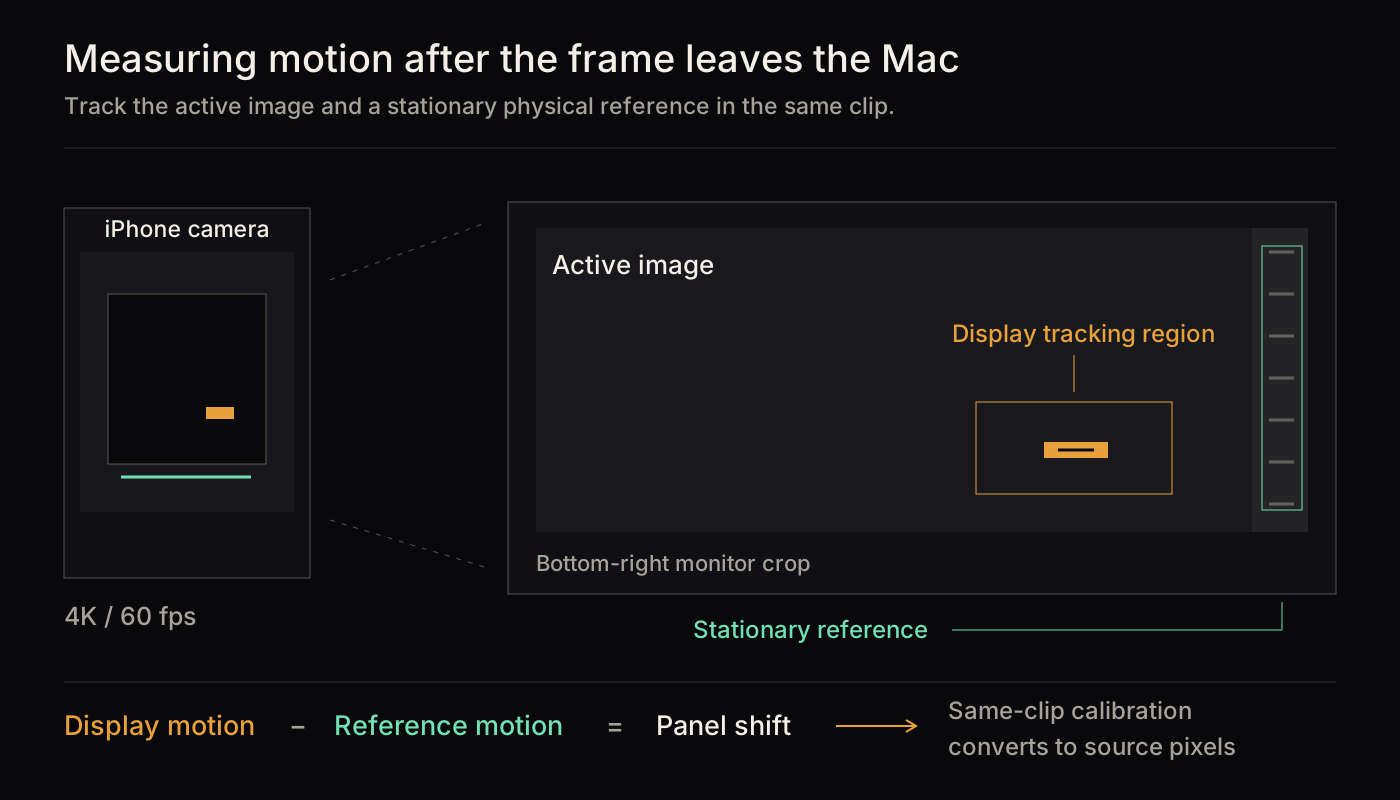
The usable measurement phase lasted 41 minutes and 50 seconds. It resolved 43 consecutive stable positions and 42 relocations. The 41 complete transition-to-transition intervals averaged 60.134 seconds. The intervals ranged from 60.118 to 60.153 seconds in the camera timebase. The transition measurements retain the individual values and reference corrections.
Fast mode therefore moved on a regular one-minute cadence in this configuration, consistent with the related source. That agreement alone does not identify the algorithm.
The complete sequence did not match Samsung's published table. A later search found exact local overlaps.
The third position rejected the exact table
An orbit can begin at any persisted index, so I did not compare the recording only with the first row of Samsung's table. The comparator tried every cyclic starting position. It used the axis direction and sign fixed during calibration. I did not select a rotation, reflection, reversal, best-fit index or time warp after seeing the result.
The first observed move was (0,+1). After two positions, exactly one of the 1,956 possible Samsung starting indices remained. From that surviving index, Samsung's next relative position was (1,0). The MSI moved to (-1,+1).
At the third position, no Samsung starting index remained. That rejects the claim that the complete MSI trace executes Samsung's published normal orbit from some unknown persisted index.
The complete 43-position trace forms a diagonal serpentine. Broader checks of starting indices, axis mappings, traversal directions and strides also failed to reproduce it. The comparison report and table diagnostics preserve those tests.
A later search found a local match: MSI positions 22 through 43 coincide with 22 consecutive Samsung positions under the calibrated axes and forward traversal. It ends at the last recorded sample, so I cannot test whether the paths continue together.
A separate match does have an observed continuation. MSI positions 15 through 33 coincide with 19 Samsung positions under reverse traversal from index 1882. At local position 20, the MSI moves to (3,-7) while Samsung moves to (5,-7). The remaining nine recorded MSI positions continue away from the Samsung route.
The two matches use different Samsung indices, directions and translations, so they do not combine into one route. The 43 decoded positions reject exact table execution. They do not recover the full private orbit or prove shared code. Related algorithms could explain the common geometry, but that remains an interpretation.
Where the black box actually begins
The firmware boundary report covers the firmware packages and public interfaces I checked. None of those routes yielded the Samsung panel executable or an external command to read its memory.
The main unknowns are the MSI's private pixel-shift generator, the hardware producing the 2024 regional map, and the sensing equations and compensation data behind panel maintenance. The public source shows commands and processing around these boundaries, not their implementations.
Going further would take new evidence: a fuller source release, a service image, or a verified dump from the matching panel controller. Investigating a spare board is another possibility. Opening my working $700 monitor to find out whether I can read anything useful from it is where my enthusiasm currently runs out.
A dump would not guarantee an answer, but I cannot call it futile either. Samsung's encrypted update packages do not establish whether this controller stores its executable encrypted. A readable memory image might contain code, calibration data or both; it would still need analysis, and some behavior may be implemented in hardware rather than firmware.
There is precedent for gaining access to Samsung TV internals through rooting research, but that work concerns the TV's main computing platform. It is not evidence of an older vulnerability in this MSI's panel controller, or a known way to read it.
If a suitable spare board turns up, or this monitor eventually dies, I may revisit the physical side. For now, I would like to keep using it as a monitor.
What this changed about the app
I don't think those three weeks were wasted. The investigation gave me a clearer reason to keep building Candela: the monitor and the Mac can act on different information, at different stages of the same problem.
The monitor receives the final video signal and can access physical panel state. It can shift the image, read temperature, change drive behavior and perform electrical compensation. Candela cannot do those jobs from macOS, and the monitor should keep doing them.
Candela can act before that signal reaches the monitor. The Mac knows when it is locked, when the user is idle and which window has focus. That gives software a way to decide which content still needs to be shown. A monitor can detect an unchanging bright region, but the video signal does not tell it whether that region belongs to an unfocused window or a menu bar the user no longer needs to see.
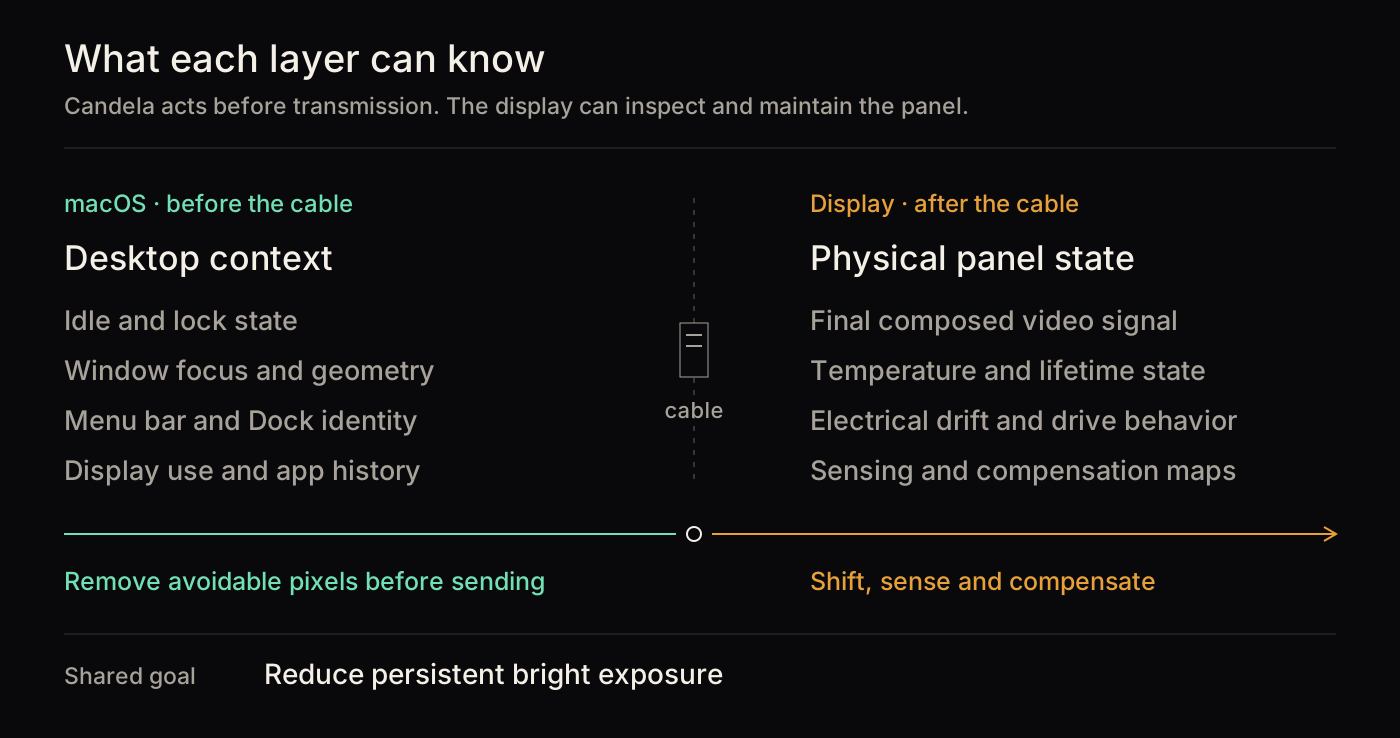
Hiding the menu bar removes that exposure from the frames being sent. Pixel shifting redistributes the image that is still being sent. Electrical compensation responds to the panel's physical condition. Those actions can work together. There is overlap in detecting and dimming static content, but the monitor's protection does not make desktop context redundant.
That is the case for Candela alongside OLED Care: use the Mac's context to reduce avoidable exposure, and let the monitor manage the panel. I have not measured how much that combination changes long-term wear. Establishing its effect on panel life would require a separate, long-term comparison. What this investigation established is a distinct job for the app, rather than a reason to replace the monitor's protection.
Check the work
The simulator and tests run synthetic scenarios without the Samsung archives. To verify source identity and compare against the published orbit tables, obtain the releases listed in the source notes and follow the README's commands.
The camera measurement report and data supplement contains decoded positions, calibration and transition measurements, camera metadata, image crops and the retained comparison reports. Those let readers inspect the measurements and replay the table comparison with the official archives.
The original 4.59 GB recording is not included. Repeating the image-tracking analysis requires that recording, or a new capture using the published stimulus and procedure. The rendered videos above illustrate the observations; they are not substitutes for the original footage.